Most of the blame for the below-expectations 1.4 percent fourth quarter GDP increase in the advance estimate can be placed on the government shutdown of October 1-November 12, 2025. Disruptions in economic activity and delays in data reporting mean that many of the assumptions in the first report are likely to be revised more than usual as the catch-up continues. The second estimate for fourth quarter GDP is set for Friday, March 13 at 8:30 ET. It may well see a bigger revision than is typical.
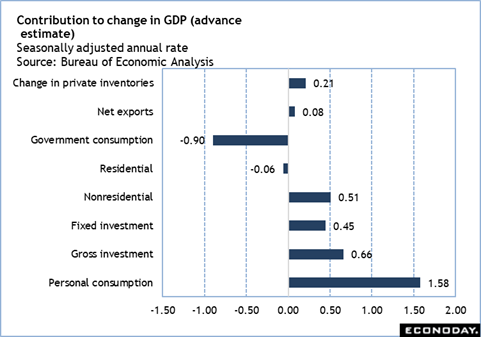
The largest contribution (1.58) to growth in the fourth quarter is a 2.4 percent increase in personal consumption expenditures. However, the composition of the increase suggests that consumers are spending less on discretionary items and more essential services. Spending on durable goods is down 0.9 percent in the fourth quarter after rising 1.6 percent in the third quarter. Consumers are pulling back on big-ticket items like motor vehicles. Nondurables spending is up 0.4 percent in the fourth quarter after up 3.9 percent in the third quarter. Falling gasoline prices is a factor here. Spending on services is up 3.4 percent in the fourth quarter, slightly less than up 3.6 percent in the third quarter. Disinflation in services continues at a glacial pace.
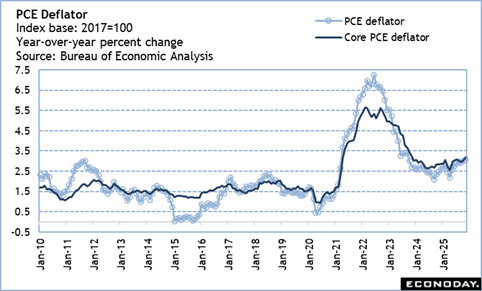
The PCE deflator for December shows that disinflation had yet to resume at year-end. The PCE deflator for all items is up 2.9 percent year-over-year in December, rising slightly from up 2.8 percent in November and 2.7 percent in October. The PCE deflator excluding food and energy is up 3.0 percent in December from a year earlier, faster than the up 2.8 percent in November and October. The PCE for durable goods is up 2.1 percent from a year ago, a jump from the up 1.0 percent in November and up 0.9 percent in October. The PCE index for nondurables is up 1.6 percent year-over-year and remains in line with readings for the prior three months. The PCE index for services is up 3.4 percent where it has been sticking for the last four months.
The December data may reflect the last big effects of the tariffs imposed earlier this year. January data for the CPI and final-demand PPI suggest that disinflation is set to resume.