The Econoday combined employment index (ECEI)[1] – factory and service sectors which account for the majority of jobs – anticipates a decline in private payrolls in April. The index is minus 1.0 in April after 0.1 in March and minus 0.8 in February. Payroll growth has been uneven since the start of 2025 and on an overall downward trend.
The Econoday employment indexes for the factory and service sectors point to mild gains in manufacturing and possible declines in private service industries.
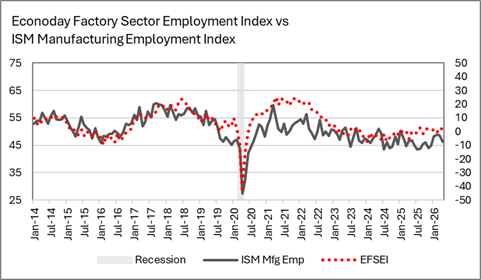
The Econoday factory sector employment index (EFSEI)[2] moderates to 1.8 in April after a modest rebound to 2.5 in March from minus 1.2 in February. Hiring in the manufacturing sector has been consistently lackluster and uneven since early 2023.
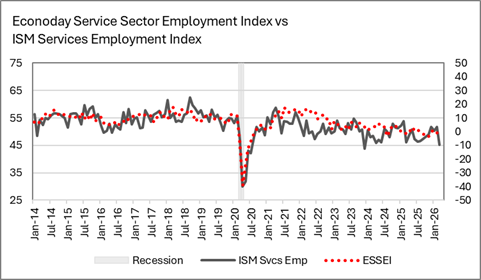
The Econoday service sector employment index (ESSEI)[3] points to a dip in payrolls at minus 1.4 in April after minus 0.3 in March and minus 0.7 in February. Hiring in services – in particular in healthcare – has been a mainstay of job gains for much of the past year. However, service businesses will be looking to cut costs in the face of rapid rises in energy prices and broader economic uncertainty. A lack of skilled workers in the sectors that still have demand will restrain adding to payrolls.
Fed policymakers have characterized the current labor market as roughly in balance between hiring and shrinkage in the pool of available workers. There were a few special factors that made payroll data noisy in the first months of the year – severe winter weather, a major strike in the healthcare sector, ongoing adaptation to new AI tools, the start of the war on Iran on February 28, and the timing of the spring holidays in late March and early April. However, the April survey period for the next monthly Employment Situation at 8:30 ET on Friday, May 8 should have moved past the worst of this. It should present a clearer picture of US labor market conditions. One month’s data should not be overemphasized. The fundamentals for the labor market are probably still “low hire, no fire” but there may be a hint that things are tipping into “no hire, no fire”.
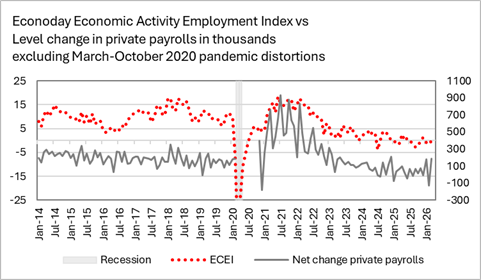
[1] The ECEI is a weighted average of the employment indexes in five Fed district bank surveys of manufacturing and non-manufacturing. The ECEI has a weak correlation (0.442) with total private payrolls. However, for total nonfarm payrolls the correlation is solid (0.984). The ECI and the net change in nonfarm payrolls moves in the same direction over 86 percent since the series start is 2014.
[2] The EFSEI is an average of the employment index in five Fed district bank surveys of manufacturing. The EFSEI has a good correlation (0.703) with the ISM manufacturing index and a loose correlation (0.619) with the month-over-month change in manufacturing payrolls in the BLS’s monthly employment report. While it does not track the size of the size of the payroll change, it does consistently signal the direction.
[3] The EFSEI is an average of the employment index in five Fed district bank surveys of non-manufacturing. The EFSEI has a good correlation (0.752) with the ISM services index and a weak correlation (0.448) with the month-over-month change in private service industry payrolls in the BLS’s monthly employment report. While it does not track the size of the size of the payroll change, it does consistently signal the direction.