With 2026 off to a good start with the advance estimate for GDP up 2.0 percent in the first quarter, attention will now be shifting to conditions in the second quarter. Will the US economy remain resilient to the impact of the conflict in the Middle East? Will the trend for solid growth in nonresidential investment – driven by AI – boost growth in the second quarter as it did in the first? How will the value of net exports and inventories affect growth if supply chains are slower and/or goods and services are more expensive? Is the labor market going to remain in its “low hire, no fire” balance or could it deteriorate as businesses cut costs during a period of rapidly rising input prices?
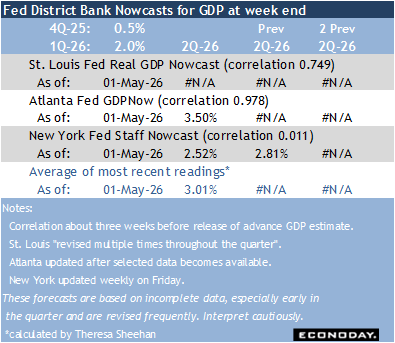
Virtually none of the data that could answer these questions is available. However, the very earliest numbers from the regional surveys of manufacturing and services, and a few other reports on things like retail spending are giving a few hints. The Econoday economic activity index (EEAI)[1] for April remains consistent with expansion. The April reading of minus 0.6 is up from minus 1.7 in March and minus 4.6 in February. The modest upward trend suggests underlying economic activity is on the rise. The first GDP forecasts for second quarter from the New York and Atlanta Feds point to rising growth in the second quarter of around 3 percent.
However, it is far too early to predict that growth in the second quarter will outshine the first quarter. Geopolitical events and the return of upward price pressures from energy costs have yet to be felt in the economic data reports. It will be weeks before a more complete picture of the US economy in the second quarter emerges and the risks to the outlook are generally to the downside. Consumers are experiencing deep pessimism and businesses are challenged with uncertainty that shows no sign of resolving in the near term. Fed policymakers are navigating the current situation with caution amid chaotic policy coming out of the White House with little check from Congress.
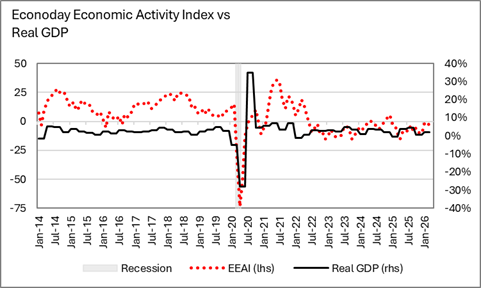
[1] The Econoday economic activity index is a weighted average of the Econoday factory sector activity index (EFSAI) and Econoday service sector activity index (ESSAI) based on their respective shares in the US labor force. Although the EEAI does not have a good correlation (0.360) with them percent change in GDP, it does tend to reflect whether GDP is rising or falling in the quarter. A EEAI reading below -0.10 is consistent with contaction.