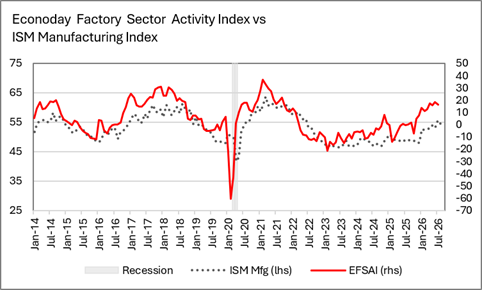
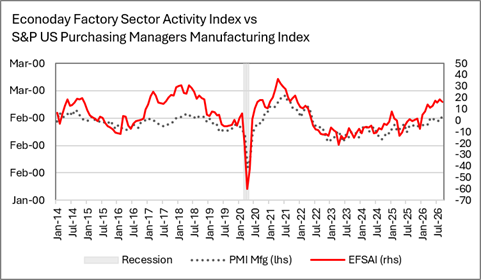
The Econoday factory sector activity index (EFSAI)* for October is 16.3 after a rise to 18.3 in September. The index has been moving in a narrow range since June that reflects modest expansion, although activity is somewhat slower in October. The index has been holding on to reasonably consistent growth since March although it has been uneven across regions and subject to shocks from energy prices.
Three of the six district bank surveys of manufacturing show gains in October (New York, Dallas, and Chicago) with two decreases (Philadelphia and Kansas City), and one steady (Richmond). Five of the six survey indexes are in positive territory (New York, Philadelphia, Dallas, Kansas City, and Chicago) and one is only mildly contractionary (Richmond). However, it should be noted that New York and Chicago both had outsized gains in October that could well unwind in November.
The reason for the slight softening in conditions in October continues the theme of recent months with fluctuating new orders, lengthening delivery times and weaker supply chains, and an uncertain economic outlook as the US midterm elections draw near along with other geopolitical upheavals.
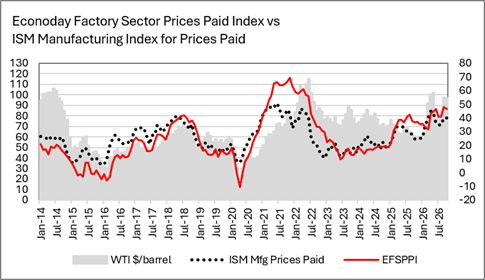
The Econoday factory sector prices paid index (EFSPPI)# eases a bit to 46.4 in October from 47.8 in September. The upward surge in energy prices has peaked and started to decline somewhat. However, energy prices – particularly for motor fuels – remain well above pre-Iran war levels. Pass through of higher costs from sources is far from over.
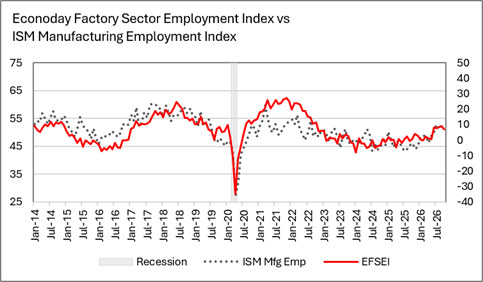
The Econoday factory sector employment index (EFSEI)## points to ongoing hiring by manufacturers, if at a slightly slower pace than the prior month. The October index of 7.0 is below 8.9 in September. The employment index has been fairly steady for the past five months. This suggests another month in which manufacturing payrolls will post a modest gain when the October employment report is released at 8:30 ET on Friday, November 6. Manufacturers have been hiring while the supply of qualified labor is available.
The EFSAI has strong correlations** with the major national indexes for activity in the factory sector. It indicates that October should be another month of moderate expansion in manufacturing in the national indicators.
The S&P manufacturing purchasing managers index had a flash reading of 57.0 for October after a final reading of 53.9 in September. This points to firming conditions in October from September but this could see some downward revision. The S&P final manufacturing index for October is set for release at 9:45 ET on Monday, November 2.
The ISM manufacturing index was down to 54.6 in September from 55.6 August. The EFSAI points to an ISM measure for October will be a bit lower than in September, but this does not change the overall picture for tempered expansion in manufacturing. The ISM manufacturing index for October is set for release at 10:00 ET on Monday, November 2.
______________
*The EFSAI is an average of seasonally adjusted indexes from the Federal Reserve district bank surveys of manufacturing that includes smoothing for month-to-month volatility. The districts correspond with about 48 percent of the US labor force. An index above 0 indicates expanding activity and below 0 indicates contracting activity.
**S&P PMI for manufacturing correlation 0.803, ISM manufacturing 0.881.
#The EFSPPI is an average of unadjusted indexes from the Federal Reserve district bank surveys of manufacturing. The EFSPPI has a correlation of 0.860 with the ISM manufacturing prices paid index.
##The EFSEI is an average of seasonally adjusted indexes from the Federal Reserve district bank surveys of manufacturing. The EFSEI has a correlation of 0.668 with the ISM manufacturing employment index.