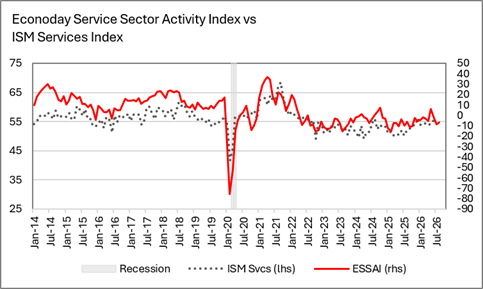
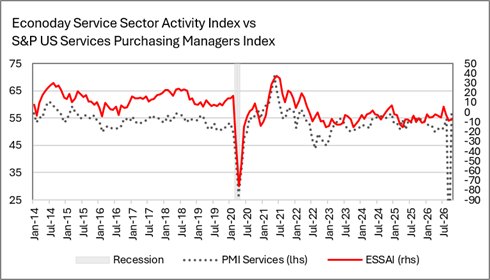
The Econoday service sector activity index (ESSAI)* for October is minus 7.0 after minus 8.7 in September and negative for the third month in a row. The ESSAI has only seen one positive reading so far in 2026 back in August when there was briefly an expectation that the war on Iran would end. However, there is a hint that service sector activity has halted the recent downward trend.
In October, two of the six Fed district bank surveys for the service sector decreased (New York and Philadelphia, Dallas) and four were higher (Richmond, Dallas, Kandas City, and Chicago). Nonetheless, three of the six survey indexes continue to show weakness (New York, Philadelphia, and Chicago) while readings at the other three were only narrowly expansionary (Richmond, Dallas, Kansas City). The service sector is feeling the impact where dollars spent on energy are reducing spending power elsewhere.
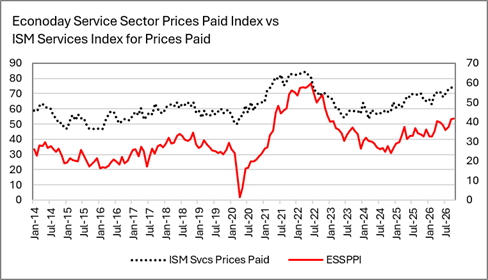
Input price gains in October were essentially stable. The Econoday service sector prices paid index (ESSPPI)# was 41.6 in October from 41.4 in September and is the highest since 42.9 in December 2022. Businesses where motor fuels factor into pricing are having the most problems with higher input costs; prices may not be rising but declines are far from returning to pre-Iran war levels. Businesses are still reeling from the jump in energy costs and how to recover from the spike.
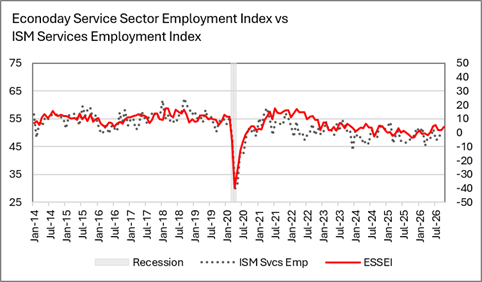
The Econoday service sector employment index (ESSEI)## is 4.0 in October from 2.0 in September. Services are reluctant to hire any but necessary workers and/or are restrained in hiring by a limited pool of qualified applicants. The change suggests that some businesses are finding the workers they need.
The ESSAI has good correlations** with the major national indexes for activity in the service sector.
The S&P services purchasing managers index had a flash reading of 57.9 for October, down from the final 58.8 in September. The index generally sees only minor revisions from the flash to the final report. The S&P index is taken later than the regional surveys and is likely the more accurate perception of current conditions for the service sector. The final S&P services purchasing managers index for October is set for release at 9:45 ET on Wednesday, November 4.
The ISM services index down to 54.9 in September from 55.4 in August. Conditions in the service sector have been more-or-less steady since 54.0 in March, but activity remains more restrained since the start of the war on Iran on February 28. The conflict remains unresolved. Even if the energy-related inflationary pressures continue to abate, service business will probably not be able to lower their prices as they make up for previous shortfalls in profits. The ISM services index for October is set for release at 10:00 ET on Wednesday, November 4.
_____
*The ESSAI is an average of seasonally adjusted indexes from the Federal Reserve district bank surveys of the non-manufacturing sector. The districts correspond with about 48 percent of the US labor force. An index above 0 indicates expanding activity and below 0 indicates contracting activity.
**S&P PMI for services index correlation 0.739, ISM services index 0.745.
#The ESSPI is an average of unadjusted indexes from the Federal Reserve district bank surveys of the non-manufacturing sector. The ESSPI has a correlation of 0.843 with the ISM services prices paid index.
##The ESSEI is an average of seasonally adjusted employment indexes from the Federal Reserve district bank surveys of the non-manufacturing sector. The index has a correlation of 0.757 with the ISM services index.