The April report on personal income and spending includes a few warning signs for economic conditions in the second quarter 2026. Personal income was unchanged in April from March. The increase in wages and salaries was only 0.2% in April. Recent months have been swinging from modest increase to little or no growth in wages and salaries. Other sources of income are seeing month-to-month volatility. Income growth feels less consistent and reliable.
Personal consumption expenditures are more-or-less back to trend at up 0.5% in April after larger increases of 1.0% in March and 0.7% in February. Bitter cold weather in February drove spending to nondurables like heating oil and electricity while reflected jump in oil prices after the attack on Iran on February 28. Spending on nondurables is up 1.0% in April after up 2.5% in March and up 0.8% in February. Consumers are paying more for energy goods and spending less elsewhere. Spending on durables is flat in April after rising 1.7% in March and 3.1% in February. Spending on services remains steady at up 0.4% in April and March after up 0.3% in February.
The savings rate fell to 2.6 in April from 3.2 in March and is the lowest since 2.0 in June 2022.
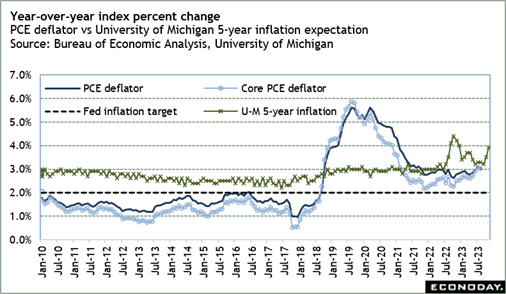
The PCE deflator – the Fed’s preferred measure of inflation – picked up the pace at up 3.8% year-over-year in April after up 3.5% in March. The April pace is the highest since 4.0% in May 2023. The core PCE deflator – excluding food and energy – is up 3.3% in April after 3.2% in March. While the increase in prices at the core is not a big acceleration, it is the highest since up 3.3% in November 2023.
When the FOMC next meets on June 17-18, the committee will have some May inflation numbers from the consumer prices index and producer prices index. However, these are unlikely to suggest that the current uptick in inflation is over. With inflation expectations for the medium term rising as well, Fed policymakers are going to remain hawkish, especially if the labor market indicators continue to signal a balance in labor supply and demand.