Edited by Simisola Fagbola, Econoday Economist
The Economy
Monetary policy
The ECB’s Governing Council pressed pause on policy, keeping its three key rates unchanged at 2.00 percent (deposit), 2.15 percent (refinancing), and 2.40 percent (lending). Inflation, now hovering near the 2 percent medium-term target, remains the anchor for policy strategy. Updated staff projections point to headline inflation averaging 2.1 percent in 2025, easing to 1.7 percent in 2026 before nudging up to 1.9 percent in 2027. Core inflation follows a similar cooling path, reflecting confidence in the disinflation trend.
Growth prospects are modestly brighter in the near term, with the 2025 GDP forecast revised up to 1.2 percent from June’s 0.9 percent. However, the outlook dims slightly in 2026 (1.0 percent) before stabilising at 1.3 percent in 2027, highlighting a still-fragile recovery.
The latest indication of the meeting is one of caution without complacency. The Governing Council underscores its data-dependent, meeting-by-meeting approach, refusing to pre-commit to a rate path while keeping all instruments ready. Asset portfolios under APP and PEPP continue to decline, reinforcing the gradual unwinding of crisis-era support.
In essence, today’s decision signals stability. Inflation is converging toward the target, growth is improving at the margins, and policy flexibility remains intact to counter risks and preserve monetary transmission across the euro area.

Inflation
China’s headline consumer price index fell 0.4 percent on the year in August after no change in July, and was flat on the month after increasing 0.4 percent previously. Inflation has now ben in negative territory for five of the last seven months. Food prices drove the sharper fall in the headline index, down 4.3 percent on the year after dropping 1.6 percent previously, but this was offset by price increases for non-food items, with core inflation increasing slightly from 0.8 percent to 0.9 percent. This is the strongest core inflation in more than two years. Producer price inflation data also published today showed ongoing weakness in price pressures.
China’s headline producer price index fell 2.9 percent on the year in August after dropping 3.6 percent in July, as it did in June. Headline PPI inflation has been in negative territory since late 2022. The index rose 0.2 percent on the month after a decline of 0.2 percent previously. Consumer price data also published today showed headline inflation moved back into negative territory in August.

JAPAN AUG CORPORATE GOODS (PRODUCER) PRICES +2.7% Y/Y (JULY REVISED TO +2.5% FROM +2.6%); MEDIAN FORECAST +2.8%.
JAPAN AUG PRODUCER PRICES -0.2% M/M, 1ST DROP IN 2 MONTHS (JULY REVISED TO +0.3% FROM +0.2%); MEDIAN FORECAST -0.1%
JAPAN PRODUCER ANNUAL INFLATION HAS SLOWED IN RECENT MONTHS ON FUEL SUBSIDIES, EASING DOMESTIC RICE SUPPLY SHORTAGES.
JAPAN AUG CGPI M/M FALL LED BY LOWER COSTS FOR UTILITIES, FARM PRODUCTS, METAL PRODUCTS.
JAPAN AUG PRODUCER INFLATION Y/Y RISE LED BY STILL HIGH FARM PRODUCE PRICES (+40.1% VS. +42.5% IN JULY).
JAPAN AUG CGPI Y/Y RISE EVEN AS KEY ENERGY PRICES CONTINUE FALLING; OIL/COAL PRODUCTS -1.5% VS. -2.0% IN JULY.

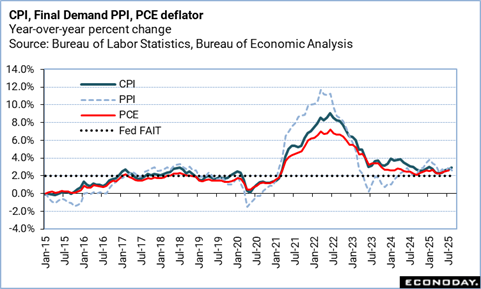
US consumer price inflation rose a little faster than expected in August, powered by a surge in housing costs. The data also showed signs of the knock-on effects from higher tariffs. For example, used car prices jumped 1 percent on a monthly basis, and are up 6 percent compared to a year ago. Still, the slow pace of August wholesale price inflation, coupled with the larger-than-expected increase in initial jobless claims, should give the Fed cover for a rate cut at the September FOMC meeting.
The Consumer Price Index in August picked up to +0.4 percent, following a 0.2 percent rise in July, and a 0.3 percent uptick in June. The August CPI reading just beat expectations for a 0.3 percent rise in the Econoday survey of forecasters. This is in line with the hotter pace of overall consumer price inflation seen this summer as the tariffs filtered through to prices.
Over the last 12 months, consumer prices are up 2.9 percent, faster than the 2.7 percent year-over-year rise in July. Expectations in the Econoday survey were for a 2.9 percent increase.
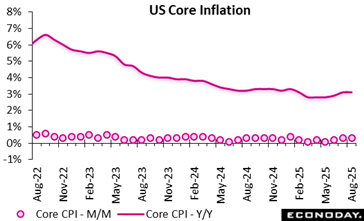
Core CPI, excluding food and energy prices, is up 0.3 percent, after rising 0.3 percent in July, and +0.2 percent in June. Consumer prices less food and energy jumped 3.1 percent from August 2024, following a 3.1 percent year-over-year rise in July and 3.1 percent expected in the Econoday survey.
After rising by 0.2 percent in July, shelter costs jumped 0.4 percent in August (and are up 3.6 percent year-over-year). Food prices surged 0.5 percent, after no change in July, with grocery prices up 0.6 percent last month (another tariff effect most likely), and restaurant prices rising 0.3 percent.
Energy costs rose 0.7 percent over the month, following a 1.1 percent drop in July – boosted by a 1.9 percent spike in gasoline prices.
Energy prices are down 0.2 percent year-over-year, following a 1.6 percent decline for the 12 months ending July. Food prices increased by 3.2 percent compared to August 2024, following a 2.9 percent rise in July.
US wholesale prices fell unexpectedly in August, although it is worth noting that the decline was due to the drop in the cost of services – not tariffs-impacted goods. While this might provide some cover for the Federal Reserve to cut rates this month, there is not enough in the data for the central bank to declare ‘Mission Accomplished’ in its inflation fight.
It is also too soon to say, however, if this is a one-off or the start of a waning impact from tariffs.
Margins for final demand trade services (a measure of the changes in margins received by wholesalers and retailers) declined 1.7 percent, after a 1 percent rise last month (and a 2.9 percent increase) compared to a year ago. This means less of the tariffs-related costs passed on to by wholesalers last month. Excluding trade services, wholesale costs were up 0.4 percent last month and jumped 2.8 percent from a year ago.
U.S. wholesale price inflation as measured by the Producer Price Index for final demand fell 0.1 percent in August, following a 0.7 percent spike (revised from +0.9 percent) in July, and nowhere near expectations for a 0.3 percent rise in the Econoday survey of forecasters. Final demand prices were up 0.1 percent in June and saw a 0.4 percent increase in May.
Compared to August 2024, final demand PPI rose 2.6 percent, compared to a 3.3 percent increase for the 12 months ended in July. Expectations were for a 3.3 percent rise.
Final demand prices excluding foods, energy, and trade services saw a 0.3 percent rise in August, following a 0.6 percent jump in July, and a 0.1 percent uptick in June. For the 12 months ended in August, prices for final demand less foods, energy, and trade services rose 2.8 percent, compared to a 2.8 percent increase on an annual basis in July.
Prices for final demand goods saw a 0.1 percent increase – following July’s 0.6 percent rise. This is the fourth consecutive monthly increase. Goods prices excluding food and energy rose 0.3 percent. Prices for final demand services saw a 0.2 percent drop in August, after a 0.7 percent jump in July. The services index excluding trade, transportation, and warehousing and for final demand transportation and warehousing services increased 0.3 percent and 0.9 percent, respectively.
August final demand prices excluding food and energy came in down 0.1 percent, following a 0.7 percent surge in July, and are up 2.8 percent from a year ago after a 3.7 percent rise in July.
Food prices rose 0.1 percent after a 1.4 percent increase in July, and jumped 3.5 percent compared to August 2024. Energy prices fell 0.4 percent in August after a 0.7 percent jump in July, but are down 1.9 percent when compared to August 2024 (after prices fell 3.2 percent on an annual basis in July).
Production
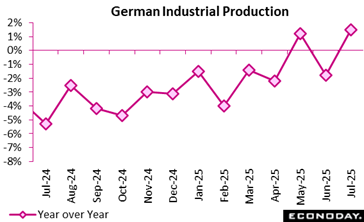
In July 2025, German industry showed signs of resilience after a sluggish start to the summer. Output rose by 1.3 percent compared with June, reversing the slight dip recorded the previous month. On an annual basis, production climbed 1.5 percent, suggesting a modest recovery despite ongoing structural challenges. The upward revision of June’s figures, mainly due to corrected data from the automotive sector, further softened the picture of earlier weakness.
The July rebound was largely driven by machinery and equipment manufacturing, which surged by 9.5 percent. The automotive (2.3 percent) and pharmaceutical (8.4 percent) industries also provided substantial boosts, reflecting renewed demand and supply-side adjustments. Consumer, intermediate, and capital goods all posted gains, indicating broad-based momentum across industrial categories.
However, not all sectors shared in the positive trend. Energy production slumped by 4.5 percent, dragging down overall performance and emphasising the continuing volatility in energy markets. Energy-intensive industries, although posting a slight month-over-month increase (0.4 percent), remained in decline year-over-year (minus 4.8 percent), highlighting the structural pressures of high energy costs.
Overall, the July figures reveal a fragile yet positive industrial outlook, characterised by a strong performance in high-value sectors, yet tempered by energy-related vulnerabilities.
US Review
Payrolls Revision Puts Things in a Different Light
By Theresa Sheehan, Econoday Economist
The release of the March 2025 benchmark revision for nonfarm payrolls stole the thunder from the reports on inflation last week. The preliminary revision of minus 911,000 is the largest after minus 902,000 for March 2009 during the Great Recession. Market reaction was swift and condemnation of the Fed was widespread for failing to have hindsight when the original data was more positive. What should be noted is that this and the 2009 revision occurred during times of events that shook the foundations of the economy and caused massive uncertainty in financial markets. As such, normal seasonal adjustment of the data is bound to be off.
The data regarding GDP growth during the same period as the revision has been pretty consistent with moderate growth. There has been no particular warning there that something was off in the state of the US economy. However, the BEA will release the annual benchmark revisions on Thursday, September 25 at 8:30 AM along with the third and final estimate of third quarter GDP. It will be interesting to see if growth in recent years is revised lower.
In any case, the August reports for final demand producer price indexes and consumer price indexes present a mixed picture.
On the one hand, the surge higher in finished goods and services seen in July has eased considerably in August, although that is mostly in services. Producer prices for goods are continuing to rise and could contribute to higher consumer prices later.
On the other hand, consumer prices in August rose about as expected and suggest that pass-through from the producer level was limited or not yet fully felt. Consumer prices for services are not accelerating while price increases for commodities are gaining some upward momentum.
The upshot is that a majority of the FOMC will want to exercise caution about setting monetary policy at their September 16-17 meeting against criticism that the Fed has been too slow to cut rates and impatience for more aggressive easing in interest rates.