Edited by Simisola Fagbola, Econoday Economist
The Economy
Inflation
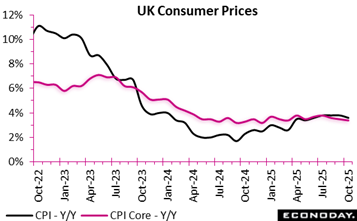
UK inflation figures for October 2025 suggest that price pressures are easing gradually, although households may still feel the strain. Annual CPI slowed to 3.6 percent, down from 3.8 percent in September, signaling a modest softening in consumer price inflation. A similar trend appears in CPIH, which fell to 3.8 percent from 4.1 percent in September, supported largely by weaker housing and household services costs. These categories provided the strongest downward pull on inflation, reflecting easing energy-related pressures.
Monthly figures also show a calmer trajectory, with both CPI and CPIH rising 0.4 percent, compared with 0.6 percent a year earlier. However, food and non-alcoholic beverages continued to push inflation upward, indicating persistent cost pressures for essential items.
Underlying inflation also moved in a favourable direction. Annually, core CPI edged down to 3.4 percent from 3.5 percent the previous month, while core CPIH fell to 3.7 percent from 3.9 percent in September, with both goods and services recording slower annual growth. Although services inflation remains relatively high, its downward movement supports expectations of a gradual return towards the Bank of England’s target.
Overall, the latest updates portray a cooling inflation environment, suggesting improving economic stability, though the pace of relief for households remains cautious and uneven.
Employment
The U.S. economy added far more jobs than expected in September, the last month with uninterrupted data collection before the federal government shutdown, although the unemployment rate ticked up. However, the numbers are significantly behind the pace set in September 2024. In addition, the number of jobs created during the prior two months was revised lower by 33,000 than previously reported.
The odds of a December rate by the Federal Reserve remain finely balanced given the lack of new inflation data to silence the hawks while this report does not fully allay concerns regarding the depth of labor market weakness.
This report takes on added significance because the impact of the prolonged government shutdown forced the BLS to cancel the release of the October employment report.
Furthermore, the November jobs data – which will also include information from the establishment survey for October – will not be published until December 16, meaning this report is the only official national employment datapoint Fed officials have in hand by the next FOMC meeting (Dec. 9-10).
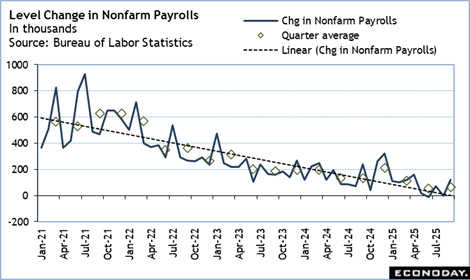
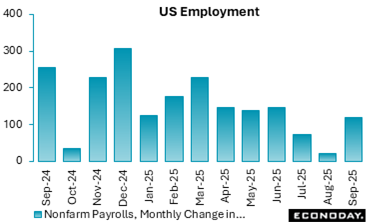
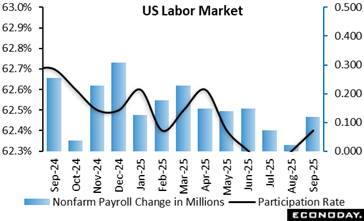
U.S. non-farm payrolls expanded by 119,000 in September, following a revised 4,000 contraction in August (previously +22,000), and +72,000 in July (previously +79,000). Expectations in the Econoday survey of forecasters was for 50,000 jobs added. September 2024 saw the economy add 240,000 jobs.
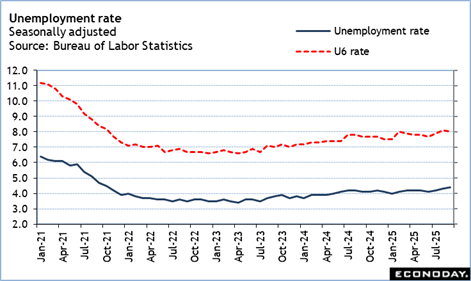
The unemployment rate came in at 4.4%, up from 4.3% in August and compared to the consensus expectations for 4.3%. The labor force participation rate ticked up to 62.4% from 62.3% in August.
Private sector employment grew by 97,000, after adding just 18,000 jobs in August (revised down from +38,000 previously reported) and 56,000 in July (previously +77,000), compared to expectations for +60,000 in the Econoday survey. Within that, the service sector added 87,000 jobs, picking up after 50,000 jobs added in August and 72,000 created in July. The private sector added 240,000 jobs in September 2024.
The tariffs-impacted goods-producing sector saw a slight rebound in job creation, adding 10,000 jobs in September after 32,000 jobs were lost in August and down by 16,000 in July.
The manufacturing sector continues to shed workers, cutting 6,0000 workers following contractions of 15,000 and 9,000, respectively, in August and July.
The data on public sector employment does not capture the month and a half long government shutdown. Federal government employment continued to decline in September (-3,000) and has contracted by 97,000 since January.
In September, the average workweek for private sector employees was 34.2 hours for the fourth month in a row. In manufacturing, the average workweek edged down to 39.9 hours from 40.0 hours in August, but overtime remained unchanged at 2.9 hours. The average workweek for production and nonsupervisory employees increased by 0.1 to 33.7 hours in September.
Given the increased attention to the affordability issues ahead of the 2026 midterm elections, the growth rate for average hourly earnings slowed down to 0.2 percent in September (slowing down from 0.3 percent in August and July) but rose 3.8 percent vs. the same month a year ago. August’s growth rate was 3.7 percent, while the CPI annual inflation rate for September was 3 percent.
GDP
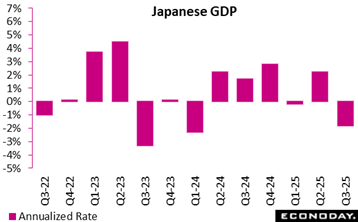
Japanese GDP shrank by 0.4 percent in the third quarter from the second quarter, a slightly milder contraction than the 0.7 percent consensus expectation. It was the first contraction in six quarters. Growth in the second quarter was revised up to 0.6 percent from 0.5 percent reported previously.
The Q3 decline reflected a pullback in net exports, as expected after US tariffs front-running skewed exports higher in the second quarter.
GDP contracted at a 1.8 percent annual rate in the third quarter after rising at an upward-revised annual 2.3 percent in the second quarter (previously 2.2 percent).
Demand
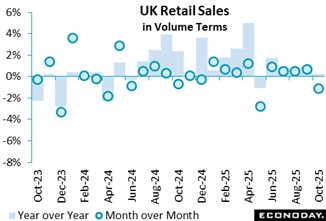
UK retail activity weakened in October 2025, with sales volumes falling by 1.1 percent. This marks the first monthly decline since May and contrasts with the gains recorded in August and September, even after revisions to those earlier figures. The decline appears broad-based, affecting supermarkets, clothing stores, and mail order retailers, which suggests a shift in consumer spending behaviour rather than sector-specific weakness.
Retailers reported that many households postponed purchases in anticipation of Black Friday discounts, indicating that promotional events are becoming a stronger driver of monthly retail cycles. This pattern reflects increasingly strategic spending, with consumers timing purchases to maximise value amid ongoing cost-of-living pressures.
Although a single monthly fall does not indicate a structural downturn, it highlights the sensitivity of retail performance to seasonal sales events and changing consumer expectations. If this behaviour continues, retailers may face more volatile month-to-month performance despite steady underlying demand. Overall, the October decline illustrates how discount-driven shopping habits are reshaping the retail landscape and influencing short-term sales dynamics.
International trade
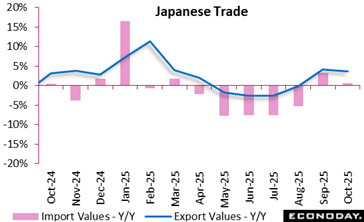
Japan’s trade data for October showed export values posted the second straight, up 3.6% on year, as the European economy continues picking up and Chian is slowly crawling out of the doldrums caused by its property market problems. By contrast, export volumes were down for 3rd straight month (-1.2% y/y), hit by the protectionist U.S. trade policy with stiff tariffs on autos and metals.
Key points:
–Exports +3.6% y/y (Sept +4.2%), 2nd straight rise; median forecast +0.8%
–Total export value ¥9.77 trln, 3rd largest on record, biggest for the month of Oct
trade:
–Imports +0.7% y/y (Sept +3.3%), 2nd straight rise; median forecast -0.9%
–Trade deficit ¥231.77 bln (Sept revised ¥237.36 bln deficit); 4th straight shortfall; median forecast ¥271.40 bln deficit
–Export y/y rise led by computer chips, engines, raw materials as largely expected; semiconductor-making equipment down
–Import y/y rise led by aircraft, engines, computers; drugs, crude oil, coal down
–Exports to US -3.1% y/y, 7th straight drop (Sept -13.3%), led by autos, chipmaking equipment, drugs; aircraft up but item fluctuates
–Exports to EU +9.2%, 3rd straight rise (Sept +5.0%), led by engines, computer chips, motorcycles; regional economy picking up
–Exports to China +2.1% y/y, 2nd straight rise (Sept +5.8%) on raw materials, computer chips, autos as seen in Sept; chip-making machines down
Business Surveys
Eurozone business activity continued to expand solidly in November 2025, with the Composite PMI at 52.4, only slightly below October’s reading. This marks the eleventh consecutive month of growth and reflects a resilient private sector despite softer momentum in new orders. The services sector remained the main engine of expansion, reaching an 18-month high, while manufacturing slipped further below 50, signalling mild contraction and a five-month low.
Demand patterns were mixed. New orders rose for a fourth month, but at a slower pace, held back by persistent weakness in export markets. This limited pressure on capacity, contributing to flat employment levels, as modest hiring in services was offset by continued job losses in manufacturing.
Price developments pointed to easing output inflation, even as input costs rose at the fastest pace in eight months due to renewed manufacturing cost pressures and strong wage-driven increases in services. Firms were therefore absorbing more costs, raising selling prices only modestly.
Manufacturing inventories fell sharply, and supply-chain delays worsened, suggesting emerging bottlenecks. Despite these challenges, business confidence strengthened, led by improved sentiment in manufacturing. Overall, the data portray steady eurozone growth but with clear headwinds from global demand and sectoral divergence.
US Review
US Employment Report Shows Q3 Pretty Steady from Q2 but Down from Q1
By Theresa Sheehan, Econoday Economist
As the US statistical agencies ramp up, they are resetting publication schedules and catching up on preparing data reports. None was more eagerly awaited than the September Employment Situation which made its appearance at 8:30 ET on Thursday.
The headline increase of 119,000 in nonfarm payrolls was well above the consensus of up 50,000, but some of the shine was taken off by a net downward revision of 33,000 for July and August. Moreover, payroll increases were largely confined to a few narrow sectors – construction was up 19,000, leisure and hospitality was up 47,000, health care was up 42,800, and government education was up 11,000 and 5,200 at the state and local levels, respectively. These total up to 125,000 new jobs, suggesting that broad-based declines are restraining gains.
The average monthly gain in the third quarter was 62,000 compared to 55,000 in the second quarter and 111,000 in the first quarter. There’s little material difference between the third and second quarter pace and which are running at about half that as seen in the first quarter. Businesses that have been struggling to fill open slots are finding an increase in labor supply among some of the newly unemployed.
Unemployment is edging higher with the September unemployment rate edging up a tenth to 4.4 percent and is the highest since 4.5 percent in October 2021. In the historical context, 4.4 percent is an enviable unemployment rate and a one-month one-tenth increase would not be worrisome. However, the rate is up for the third month in a row. The labor market has yet to settle out as it adjusts to the disruptions of Trump administration policies and the widespread adoption of artificial intelligence (AI) tools.
The September employment report contains relatively old data. With the fourth quarter already halfway over, the outlook for the October and November employment reports is much more important. The BLS has said there will be no household survey conducted for the October data even though the establishment survey will take place. There will also be no specific October report. Instead, it will be folded into the November Employment Situation now set for release at 8:30 ET on Tuesday, December 19 (previously December 5).
The timing of the release means that the September employment report is the only one the FOMC will have at their next meeting. Policymakers will get some missing data like the weekly jobless claims numbers, but for payrolls will have to rely on private sources again. The meeting will include an update to the summary of economic projections (SEP).