Edited by Simisola Fagbola, Econoday Economist
The Economy
Monetary policy
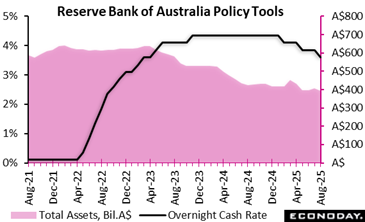
The Reserve Bank of Australia lowered its main policy rate, the cash rate, by 25 basis points from 3.85 percent to 3.60 percent at its meeting today, in line with the consensus forecast. This rate was left on hold at the RBA’s previous meeting in July after it was cut in April. The rate decision coincided with the publication of updated economic forecasts in the quarterly Statement on Monetary Policy.
In the statement accompanying the decision, officials pointed to recent declines in inflation and noted updated staff forecasts indicating that underlying inflation will continue to moderate to around the midpoint of the target range of two percent to three percent. Despite ongoing tightness in the labour market, officials noted that uncertainty over global trade tensions represent a risk to household and business spending.
Reflecting these considerations, officials concluded that a rate cut was warranted today but they also stressed that the remain cautious about the outlook. They again noted that monetary policy is well placed for them to “respond decisively” if external factors weigh on domestic economic conditions.
The decision that a rate cut is warranted reflects the fact that officials remain confident about the inflation outlook. Headline inflation is still forecast to be 3.0 percent at end-2025 and 3.1 percent at mid-2026, with the end-2026 forecast revised up slightly from 2.8 percent to 2.9 percent. The forecast for the trimmed mean measure of inflation at end-2026 remains unchanged at 2.6 percent. Both measures of inflation are forecast to be at 2.5 percent mid-2027, down from 2.6 percent previously.
Officials have also revised down their growth forecasts. Australia’s economy is now forecast to expand by 1.7 percent on the year in the three months to December 2025, down from 2.1 percent previously, and by 2.1 percent in the three months to December 2026, down from 2.2 percent previously.
Inflation
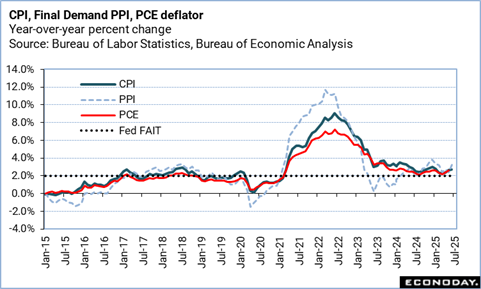
July’s US consumer price inflation reading is benign on the surface but contains signs underneath of the expected inflationary effects of higher tariffs. For example, prices for furniture, photographic equipment, vehicles rose on a monthly basis at the fastest rate since April or May. However, the fact that the impact is not more widespread might allow the Fed greater confidence to lower interest rates in September.
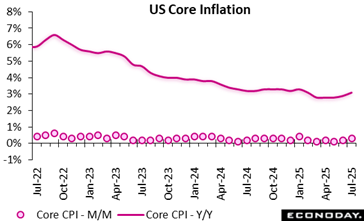
The Consumer Price Index in July slowed to +0.2 percent, following a 0.3 percent rise in June, and a 0.1 percent uptick in May. The July CPI reading matches expectations for a 0.2 percent rise in the Econoday survey of forecasters. This marks a return to the slower monthly pace of overall consumer price inflation seen between February and May.
Over the last 12 months, consumer prices are up 2.7 percent, matching the 2.7 percent year-over-year rise in June. Expectations in the Econoday survey were for a 2.8 percent increase.
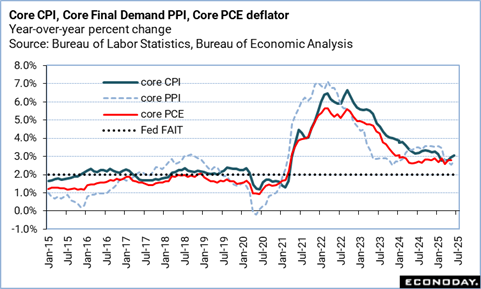
Core CPI, excluding food and energy prices, is up 0.3 percent, after rising 0.2 percent in June, and +0.1 percent in May. Consumer prices less food and energy jumped 3.1 percent from July 2024, following a 2.9 percent year-over-year rise in June, and 3 percent expected in the Econoday survey.
After rising by 0.2 percent in June, shelter costs rose by 0.2 percent in July (and are up 3.7 percent year-over-year). Food prices were flat, after a 0.3 percent jump in June, with grocery prices down 0.1 percent last month, and restaurant prices rising 0.3 percent.
Energy costs contracted by 1.1 percent over the month, following a 0.9 percent spike in June – dragged down by a 2.2 percent fall in gasoline prices.
Energy prices are down 1.6 percent year-over-year, following a 0.8 percent dip for the 12 months ending June. Food prices increased by x percent compared to July 2024, following a 3 percent rise in June.
Employment
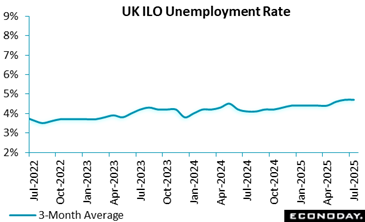
The UK labour market in mid-2025 showed that payrolled employees declined by 149,000 over the year to June and a further 164,000 by July, signalling subdued hiring momentum. While the employment rate for 16–64-year-olds rose to 75.3 percent, unemployment edged up to 4.7 percent, suggesting more people are actively seeking work. Economic inactivity fell to 21.0 percent, hinting at a gradual re-entry into the workforce.
Vacancies fell for the 37th consecutive period, down 44,000 to 718,000, with most industries reporting fewer openings, reflecting possible caution among employers about recruitment or replacement hiring. Wages continued to grow robustly, with regular earnings up 5.0 percent and higher in the public sector (5.7 percent) than in the private sector (4.8%), while total earnings including bonuses, were 4.6 percent. Real pay growth remained modest at 0.9% (CPIH-adjusted), indicating inflation’s lingering squeeze on household purchasing power.
Meanwhile, the Claimant Count fell to 1.695 million, offering a counterpoint to softening payroll numbers. However, 38,000 working days were lost to labour disputes in June, underscoring ongoing tensions in pay and conditions. Overall, the data suggest a labour market in transition, holding steady in employment rates but facing persistent recruitment caution and wage-price pressures.
GDP
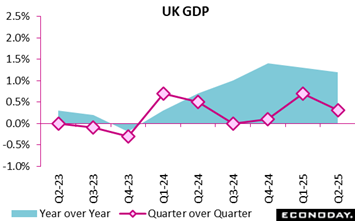
The UK economy maintained its growth trajectory in the second quarter of 2025, with GDP rising by 0.3 percent, following a stronger 0.7 percent expansion in the first quarter. Compared with the same period in 2024, GDP grew by 1.2 percent, reflecting steady but moderating momentum.
In output terms, services, the UK’s dominant sector, expanded by 0.4 percent, while construction posted robust growth of 1.2 percent, underscoring resilience in infrastructure and building activity. However, production contracted by 0.3 percent, highlighting continued pressures in manufacturing and related industries.
Real GDP per head grew by 0.2 percent in the quarter, and by 0.7 percent year-over-year, indicating that output gains were modest once population growth was factored in. Importantly, no revisions were made to previously published GDP figures, with more comprehensive data updates scheduled for August and September 2025 under the National Accounts Revisions Policy.
Overall, the second quarter performance points to a steady, service-led economy bolstered by construction, but tempered by weakness in production.
Demand
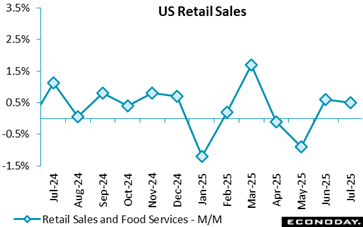
U.S. retail sales came in as expected in July while June’s reading was revised higher. The underlying data is a mixed bag, with contractions in some sectors with an exposure to tariffs, but enough spending resilience in categories like autos, as well as department and furniture stores. Enough consumer resilience for Federal Reserve officials to remain patient regarding the timing of the next rate cut.
U.S. July retail sales jumped by 0.5 percent, building on the revised 0.9 percent monthly surge reported for June (previously +0.6 percent), and as expected by the consensus in the Econoday survey of forecasters.
However, core retail sales, removing autos and gasoline sales, only increased 0.2 percent last month following a revised up 0.8 percent reading in June (previously reported as +0.6 percent). Core retail sales are up 4.4 percent on an annual basis in July compared to a 4.6 percent y/y jump in June.
Auto sales rose 1.7 percent in July, following June’s 1.6 percent increase, and are up 4.9 percent vs. last year. Activity continues its recovery after dwindling following the pre-tariffs spike in March.
Summer spending is solid, but there sales contracted in sectors with exposure to higher tariffs. Building materials, garden equipment and suppliers’ sales fell 1.0 percent in July, electronics and appliances were down 0.6 percent, and miscellaneous store retailers saw a 1.7 percent contraction.
E-commerce sales slowed slightly to a 0.8 percent increase in July from +0.9 percent in June, and they are 8.0 percent higher than a year ago.
Compared to a year ago, July retail sales are up 3.9 percent, compared to June’s 4.4 percent jump.
Excluding gasoline, retail sales increased 0.5 percent, after June’s 0.9 percent increase, and jumped 4.5 percent from July 2024 vs. +5.0 percent on an annual basis in June.
Stripping out purchases of motor vehicles and parts, sales rose 0.3 percent compared to a 0.8 percent increase (previously +0.5 percent) in June. On an annual basis, retail sales ex-autos are up 3.7 percent, a slight slowdown from June’s 3.8 percent pace.
Sentiment
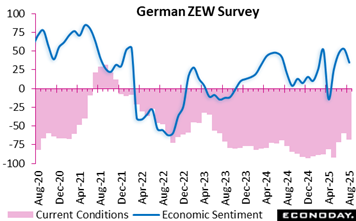
Germany’s economic mood darkened in August 2025, with the economic sentiment indicator plunging to 34.7, down 18 points from July. This marks a break in the months-long upward trend, reflecting growing unease among financial market experts. The current situation assessment slid further into negative territory at minus 68.6, driven by weak second quarter performance and sector-specific pressures.
The recently announced EU–US trade deal, instead of boosting confidence, sparked disappointment. Concerns centre on its limited benefits for key German industries, particularly chemicals, pharmaceuticals, mechanical engineering, metals, and automotive, already grappling with subdued demand.
The broader eurozone outlook mirrored Germany’s downturn. Economic sentiment fell to 25.1, a drop of 11 points, with the current situation index declining to minus 31.2. Downward revisions to growth expectations underscore that the slowdown is not confined to Germany but extends across the monetary union.
In essence, August’s results reveal a fragile recovery overshadowed by trade deal skepticism, persistent industrial headwinds, and a softening eurozone outlook, painting a picture of cautious optimism giving way to renewed concern.
Business Surveys
US Review
CPI and PPI-FD Show Import Cost Pressures Rising
By Theresa Sheehan, Econoday Economist
The consumer price index (CPI) and final-demand producer price index (PPI-FD) for July both suggest that price pressures are starting to swing higher. Digging through the data, it is fairly clear that prices are going up in categories related to imports. New tariffs and consequent efforts by businesses to recoup the costs are becoming more visible. It is less obvious in the July CPI numbers, but the PPI points to rising prices at the consumer level in coming months.
This is not unexpected. What remains in question is how much of the costs will consumers be asked to pay, how big those costs are, and how long will it take to pass through the inflation data? Upward price pressures are evident for commodities and services, and are broad-based. However, it is in the food and energy categories that consumers are likely to feel the greatest discomfort.
If prices for food were unchanged in the CPI index for July from June, the PPI for final demand foods is up 1.4 percent. The CPI for energy was down 1.1 percent in July from the prior month, but the PPI energy index shows a 0.9 percent increase. These commodities have a direct and immediate impact on household incomes and spending.
The services used by households are many and varied. The impact of price changes is harder to parse out. Nonetheless, service businesses often have little choice but to pass on costs to customers. The CPI for all services was up 0.3 percent in July, while the PPI for final demand services is up 1.1 percent. Some of this is likely to show up in transportation where passenger carriers and shippers commonly increase fees to move goods and deliver services.
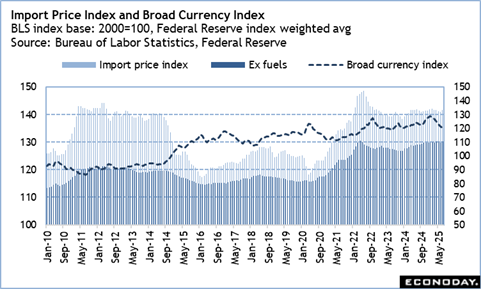
The import price index for July shows a 0.4 percent increase from the prior month, although it is down 0.2 percent year-over-year. The index for imported fuels – which are priced in US dollars – is up 2.7 percent in July, and down 12.1 percent year-over-year. The import price index for nonfuels is up 0.3 percent in July and 0.9 percent higher than a year ago. In part, the weaker US dollar versus a broad basket of currencies means imports are getting more expensive.