Edited by Simisola Fagbola, Econoday Economist
The Economy
Monetary policy
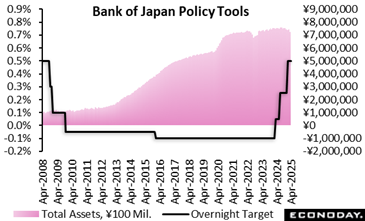
The Bank of Japan’s nine-member board voted unanimously to maintain the target for overnight interest rate at 0.5%, as widely expected, amid high uncertainty over global growth and inflation sparked by stiff Trump tariffs, after having stood pat in March. Previously, the panel voted 8 to 1 to raise the policy rate by another 25 basis points to 0.5% in a third rate hike during the current normalization process that began in March 2024.
Citing "significantly low" real interest rates, the board repeated its conviction that it should be able to continue raising the target for overnight interest rates and "adjust the degree of monetary accommodation" without hurting economic activity. Given “extremely high uncertainties” over the global trade war launched by President Trump, “it is important for the bank to carefully examine” how growth and inflation evolve and how financial markets move and “judge whether the outlook will be realized without any preconceptions.”
The board revised down its growth and inflation forecasts for both fiscal 2025 and fiscal 2026 ending in March 2027. It also noted that risks to its GDP and CPI outlook is skewed to the downside. Despite the trade war headwinds, the BOJ continues to expect Japan will steer clear of slipping back into deflation and settle around 2% inflation. “In the second half of the projection period (fiscal 2025 through fiscal 2027), underlying CPI inflation is likely to be at a level that is generally consistent with the price stability target.
The median projections by the board from its quarterly Outlook Report:
FY24 core CPI (ex-fresh food) +2.7% (actual) vs. +2.7% in January
FY25 core CPI (ex-fresh food) +2.2% vs. +2.4% in January
FY26 core CPI (ex-fresh food) +1.7% vs. +2.0% in January
FY27 core CPI (ex-fresh food) +1.9% (first estimate)
FY24 GDP +0.7% vs. +0.5% in January
FY25 GDP +0.5% vs. +1.1% in January
FY26 GDP +0.7% vs. +1.0% in January
FY27 GDP +1.0% (first estimate)
The trade conflict prompted the BOJ to downgrade its overall assessment, saying, “Japan’s economic growth is likely to moderate” as trade and other policies lead to a slowdown in overseas economies and to a decline in domestic corporate profits despite support from accommodative financial conditions. “Thereafter, Japan’s economic growth rate is likely to rise, with overseas economies returning to a moderate growth path.”
Board members warned that there are various risks to their outlook. “In particular, it is extremely uncertain how trade and other policies in each jurisdiction will evolve and how overseas economic activity and prices will react to them,” the BOJ said. “It is therefore necessary to pay due attention to the impact of these developments on financial and foreign exchange markets and on Japan’s economic activity and prices.
BOJ policymakers are closely monitoring whether expected high wage increases by major firms will spread to smaller firms in fiscal 2025 starting on April 1 at a time when real wages are falling, which could hurt consumption further and generate deflationary pressures.
The BOJ appears to be still on course for two more 25 basis point rate hikes that would eventually take the overnight interest rate target to 1%. The bank is in the process of normalizing its policy by gradually lifting the rates that had been in a range of zero and slightly negative until a year ago. The BOJ under Governor Kazuo Ueda, who took office in April 2023, shifted gear in March 2024 with its first rate hike in 17 years and an end to the seven-year-old yield curve control framework, following a decade of large monetary easing aimed at reflating the economy. The board stood pat in December, October and September after voting 7 to 2 in July to hike the rate to 0.25% from a range of 0% to 0.1%.
Inflation
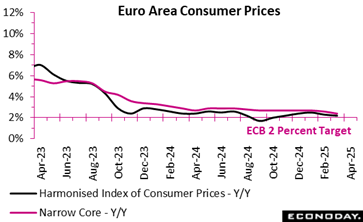
In April 2025, euro area inflation held steady at 2.2 percent, suggesting price pressures remain contained despite notable shifts within key sectors. The services sector drove overall inflation higher, rising to 3.9 percent from 3.5 percent in March, likely reflecting persistent wage growth and resilient consumer demand. Food, alcohol, and tobacco inflation edged up slightly to 3.0 percent, maintaining their role as steady contributors to overall price levels.
Meanwhile, non-energy industrial goods remained unchanged at 0.6 percent, indicating subdued demand or improved supply chain stability. The most striking movement came from the energy sector, where prices fell sharply by 3.5 percent, deepening the previous month’s decline of 1.0 percent, and exerting a significant dampening effect on headline inflation.
Among the biggest economies in the area, annual inflation should remain steady between March and April in Spain (2.2 percent after 2.2 percent) and Italy (2.1 percent after 2.1 percent). However, it should fall in Germany (2.2 percent after 2.3 percent) and France (0.8 percent after 0.9 percent).
This divergence across sectors highlights the complex inflationary dynamics: while consumer-facing services and essential goods are becoming more expensive, falling energy costs are providing relief. As the European Central Bank considers its next steps, the mix of sticky service inflation and declining energy prices presents a policy puzzle that calls for carefully balancing growth support and inflation control.
Employment
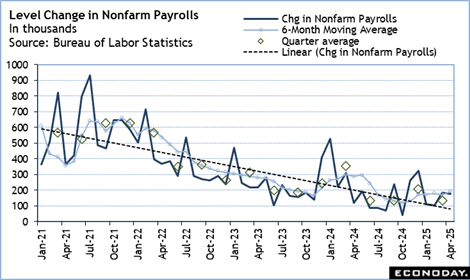
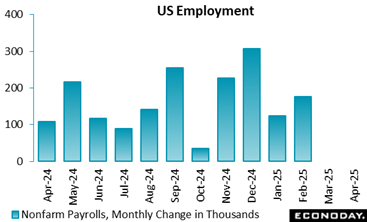
US Nonfarm payrolls rise 177,000 in April, above the consensus of up 130,000 in the Econoday survey of forecasters. However, there is a net downward revision of 58,000 to the prior two months that takes some of the shine off the headline.
Private payrolls are up 167,000 in April. Goods-producers added 11,000 jobs that was due to an 11,000 increase in construction. Service-providers added 156,000 jobs, nearly half of which was from a 70,000 increase in private education and health services. Government payrolls are up 10,000. Federal jobs are down 9,000, while state government is up 6,000 and local government is up 13,000.
Average hourly earnings in April are up 0.2 percent month-over-month and up 3.8 percent year-over-year. The underlying trend for year-over-year increases seems to have stabilized just under 4 percent. The average workweek is unchanged at 34.3 hours in April.
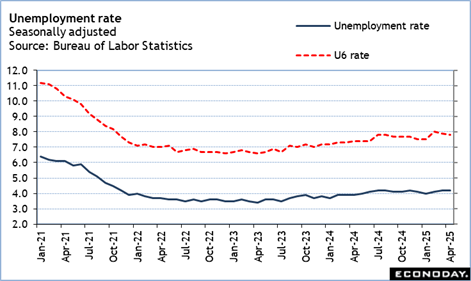
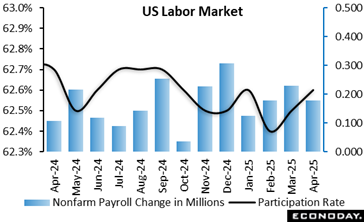
The unemployment rate is unchanged at 4.2 in April from March, although the unrounded rate is a bit higher at 4.1874 percent in April from 4.1520 percent in the prior month. The U-6 unemployment rate – the broadest measure of unemployment – is down a tenth to 7.8 percent. The labor force grew by 518,000 to 171.109 in April with the number of people employed up 436,000 and the unemployed up 82,000.
The labor force participation rate is at 62.6 percent in April, up a tenth from the prior month. This is well within normal monthly variation and remains in line with readings for the past year.
Fed policymakers will carefully parse this report when they meet on May 6-7. There are a few hints of further cooling in the labor market, but so far nothing that points to substantial deterioration in conditions. With the data related to the maximum employment side of the dual mandate still solid, the FOMC will be more focused on the price stability side and the data on inflation and inflation expectations.
GDP
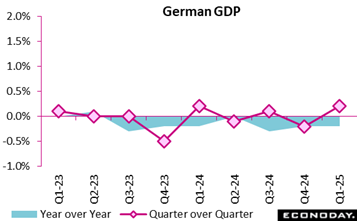
Germany’s economy showed cautious signs of recovery in early 2025, with GDP increasing by 0.2 percent in the first quarter compared to the previous quarter. This latest update aligns with the consensus forecast and reverses the 0.2 percent contraction seen at the end of 2024. This modest quarterly growth, supported by a rebound in private consumption and investment, suggests a tentative return to consumer and business confidence.
However, the year-over-year picture remains subdued: GDP was still 0.2 percent lower than in the first quarter of 2024, in line with the consensus forecast and after adjusting for both prices and calendar effects. This annual decline reflects lingering economic headwinds as inflation continues to stay above the 2 percent target, while economic uncertainty and trade tensions from the US continue to becloud the headwinds.
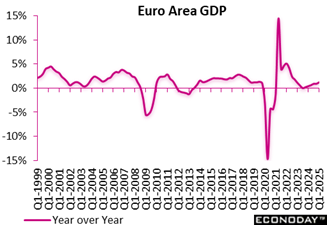
The euro area continued its steady, if modest, upward trajectory in early 2025 as GDP rose by 0.4 percent in the euro area in the first quarter, maintaining the slight recovery seen at the end of 2024. This was 0.2 percent more than the consensus forecast for the period. On an annual basis, the euro area recorded higher growth at 1.2 percent, unchanged from the previous quarter and 0.2 percentage points higher than the consensus forecast for the period.
This suggests a stabilising economic environment, supported by resilient domestic demand and improving investment conditions. Although the pace remains moderate, the consistency in year-over-year figures reflects underlying economic resilience amid broader global uncertainties.
Within the region’s quarterly advance, France expanded 0.1 percent after minus 0.1 percent. Spain grew 0.6 percent after 0.7 percent. Germany grew 0.2 percent after minus 0.2 percent, while Italy also rose 0.3 percent after 0.2 percent.
The advance estimate of first quarter GDP shows growth down 0.3 percent, the first negative quarter since down 1.0 percent in the first quarter 2022. The advance estimate is below the consensus of up 0.2 percent in the Econoday survey of forecasters. Growth was dragged lower mainly by a large widening in the trade deficit that was related to anticipation of higher tariffs and consequently costlier imports.
Two quarters in a row of negative growth is a rule of thumb for determining if the economy is in recession. The first quarter of the year is typically the weakest one. In 2025, this is probably being exaggerated by front-loaded activity to get ahead of expected tariffs. Some of this should be more normal in the second quarter, although growth will feel the effects of elevated uncertainty that will stifle some spending and investment. While the dip in growth in the first quarter is attributable to special factors, the underlying tone is for softer economic conditions and little momentum for future growth.
Net exports show a deficit of $1.262 trillion in the first quarter after $920.1 billion in the fourth quarters. Net exports made a negative contribution of 4.83. Some of the imports of goods went into inventories. The change in private inventories jumps to $181.7 billion in the first quarter from $13.6 billion in the fourth quarter and makes a positive contribution of 2.25.
Personal consumption expenditures are up 1.8 percent in the first quarter and make a smaller than usual positive contribution of 1.21. Spending on durable goods is down 3.4 percent after demand was exhausted in the fourth quarter when spending rose 12.4 percent. Spending on nondurables is up 2.7 percent in the first quarter and up 2.4 percent on services.
Government consumption is down 1.4 percent in the first quarter for a negative contribution of 0.25. Slashing of payrolls, services, and other expenditures had an impact.
Gross investment jumps 21.9 percent in the first quarter and makes a positive 3.60 contribution to growth. Businesses are acting to invest in equipment before prices go up and/or supply chains get disrupted. This will probably borrow activity from future quarters. Fixed investment is up 7.8 percent in the first quarter, with nonresidential fixed investment up 9.8 percent and residential investment up 1.3 percent.
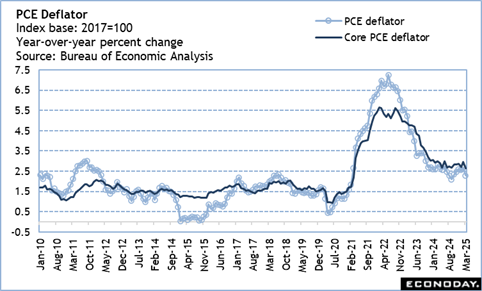
The quarterly PCE index is up 3.6 percent in the first quarter compared to up 2.4 percent in the fourth quarter. The quarterly core PCE index is up 3.5 percent from 2.6 percent in the prior quarter.
Demand
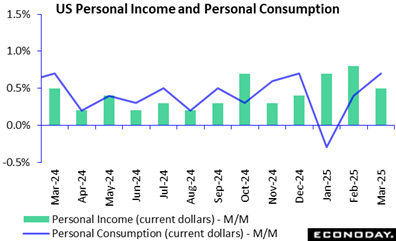
U.S. personal income rose by 0.5 percent in March, compared to a 0.7 percent increase in February and above expectations for a 0.4 percent rise in the Econoday survey of forecasters. Consumer spending, as measured by the Personal Consumption Expenditures (PCE) index, jumped by 0.7 percent last month following a revised 0.5 percent increase in February (previously +0.7 percent).
As for the Federal Reserve’s preferred inflation gauge, the PCE price index was unchanged on a monthly basis in March, after a 0.4 percent rise in both February and January. Prices for goods fell 0.5 percent and prices for services increased 0.2 percent. Food prices rose 0.5 percent and energy prices plunged 2.7 percent. Excluding food and energy, the PCE price index was also flat following a 0.5 percent rise in February.
Compared to a year ago, the March PCE price index rose 2.3 percent after a 2.5 increase in February. Prices for goods contracted by 0.3 percent and the cost of services jumped 3.5 percent. The core PCE price index is up 2.6 percent from March 2024, compared to February’s 3 percent year-over-year increase.
The slowdown in the pace of annual PCE price inflation is encouraging; however, the data does not capture the impact of the global reciprocal tariffs imposed by the Trump administration in early April. As the most recent Beige Book noted, the uncertainty around trade policy has stalled economic activity while costs are likely to increase due to tariffs. Expect the Federal Reserve to remain on hold as it continues to assess the balance of risks to the economy.
Business Surveys
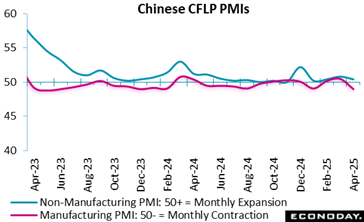
Official Chinese PMI survey data show conditions in China’s aggregate economy deteriorated in April, perhaps reflecting the impact of the escalation in global trade tensions and market volatility seen since the start of the month. The headline index for the CFLP manufacturing fell sharply from 50.5 in March to 49.0 in April, indicating renewed contraction in the sector after two months of modest expansion, while the non-manufacturing PMI fell from 50.8 to 50.4. The composite index covering the entire economy fell from 51.4 in March to 50.2 in April, its lowest level since January.
The headline index for the manufacturing and non-manufacturing PMIs were both below the consensus forecasts of 49.7 and 50.5 respectively.
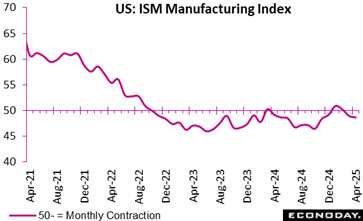
The ISM manufacturing index comes in at 48.7 for April, slightly above the 47.9 consensus expectation, and little changed from 49.0 in March, which indicates slow contraction continues. ISM notes that survey respondents appear focused on fallout from tariffs as tariff-related comments dominate.
Tariffs are depressing demand and pushing up raw materials costs notably, ISM says. New orders, the forward-looking indicator, edge up to 47.2 from 45.2 but show continued contraction. New export orders, among the most tariff-sensitive indicators, are down to 43.1 in April from 49.6 in March.
Prices paid for commodities rise to 69.8 from 69.4. This index is up 15 points over the last six months to reach its highest since June 2022.
US Review
PCE Deflator Suggests Encouraging Return to Deflation
By Theresa Sheehan, Econoday Economist
With the May 6-7 FOMC meeting on the near horizon, the data that stands out for this week is the PCE deflator for March and the April monthly employment numbers. The 0.3 percent dip in the advance estimate of first quarter GDP really wasn’t much of a surprise. Fed policymakers won’t discount it, but they will put it in the context of significant disruptions to normal trade flows of goods and services.
The PCE deflator for March is up 2.3 percent year-over-year, not far from the Fed’s 2 percent inflation objective. It is also down four-tenths from the prior month’s reading. It suggests a prompt resumption of disinflationary conditions. The core PCE deflator is also down four-tenths from the prior month to up 2.6 percent from March 2024. This is the lowest year-over-year increase since up 2.2 percent in March 2021. Is this enough to make the FOMC consider easing monetary policy? Recent remarks by Fed Chair Jerome Powell would say no. It is one month’s data. Powell has said that policymakers can afford to be patient. In light of the rapid escalation in readings of inflation expectations, caution will rule the meeting.
The April data on payrolls and the unemployment rate broadly confirm that the US labor market remains solid for the time being. The April payroll increase of 177,000 is softened by a net downward revision of 58,000 in the prior two months but indicates that the labor market is able to absorb new entrants and find work for those separated from their jobs. The unemployment rate of 4.2 percent indicates that there has been no major change in the share of the labor force that is unemployed.