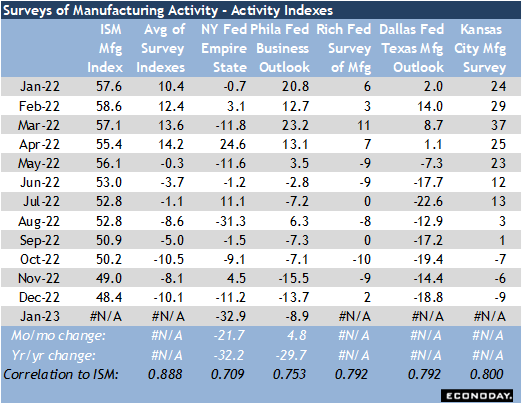
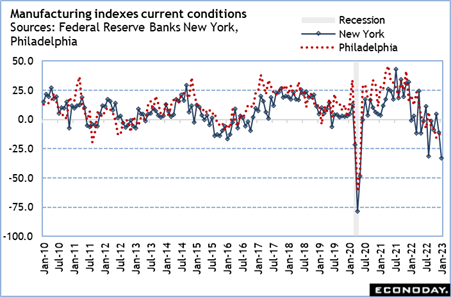
The general business conditions index in the New York Fed’s Empire State manufacturing survey plunged 21.7 points to minus 32.9, its lowest since minus 78.2 in April 2020 and minus 48.5 in May 2020 during the first months of the pandemic. Before that it was minus 33.7 in March 2009 during the Great Recession.
The general business conditions index in the Philadelphia Fed’s manufacturing report rose 4.8 points to minus 8.9 in January. It has been in contraction since September 2021, but at readings that are consistent with modest slowing.
The two indexes, which are calculated from single questions, do not move in lockstep and have only a so-so correlation with each other (0.735). While the drop in the New York measure should not be completely ignored, it also is the weaker predictor of overall manufacturing activity when compared to the ISM’s manufacturing composite. It also tends to swing month-to-month more than the other district bank surveys. The New York index has a correlation of 0.709 with the ISM while Philadelphia’s is 0.753. Note that both of these are the weakest ISM correlations among the district bank manufacturing surveys. Richmond and Dallas’ correlations are both 0.792 and Kansas City’s is the best of all at 0.800.
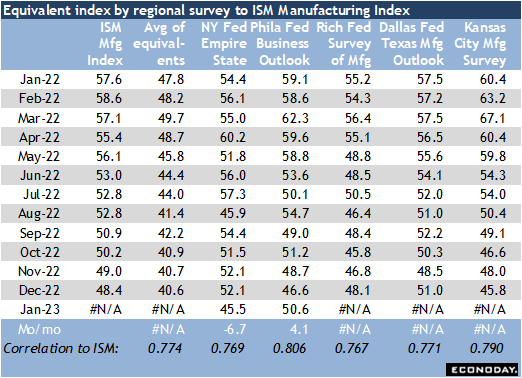
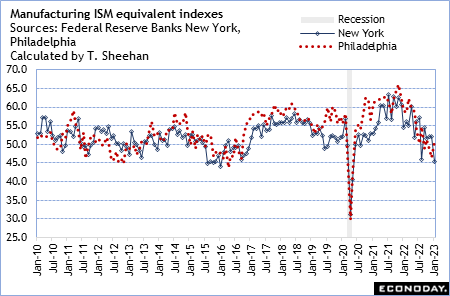
It is also worth mentioning that the ISM-equivalent indexes for New York and Philadelphia – when calculated using the five components most like those in the ISM composite – are less exaggerated in their changes. The New York-ISM equivalent is down 6.7 points to 45.5 in January and the Philadelphia-ISM equivalent is up 4.1 points to 50.6. The New York measure has a decent correlation with the ISM index (0.769) which is similar to that for Richmond (0.767), Dallas (0.771), and Kansas City (0.790). The Philadelphia equivalent has the best correlation (0.806).
The bottom line is that while the manufacturing sector is slowing and could be nearing a recession, though there are other surveys coming that could shift the outlook one way or another. The risks are to the downside.
One final note: the Philadelphia report included annual revisions which included adjustments intended to compensate for the unusual circumstances in 2020 and 2021. The New York report also included its annual revisions, but seasonal adjustment factors were calculated through 2019 only and remained the same for 2020-2023. Thus, there was no revision to the indexes in the last few years.